This blog has been updated on - February 19, 2024
Research data analytics involves more rigorous, efficient, and cutting-edge methods to conduct complex surveys and research work.
Top-notch researchers and surveyors rely on advanced data analytics to reveal interesting facts and resolve problems. Telling stories based on statistical insights enables them to unveil unexpected patterns, experiences, and outcomes worth exploring for growing enterprises.
Every business takes insights from research papers and surveys, including healthcare, to medical educators, finance economists, and leading industrialists before applying any strategy or plan. For high productivity, sales, and better marketing outcomes, they conduct thorough market research to make the right business decisions.
Achieving research excellence with data-driven analysis is what you must focus on being a research leader and academic professional. Here's a blog to learn why.
Table of Contents:
Regardless of being a business decision-maker or analyst, research analytics does wonders for any investment inspired by information or facts derived from statistical surveys.
Numerous research analysts and consultants publish factual resources and research findings for different industries and business domains. Let's see how data analysis in research works for surveyors like you.
What Is Research Data Analytics?
It's a process that uses data analysis in research to churn out a factual story or reports from a vast volume of datasets and interpret insights from the same.
Most researchers and analysts combine big data and advanced BI tools to summarize tons of data into fragments and analyze them to generate real-time reports.
Enterprises wanting to track past and ongoing market trends to plan out their business strategy can use research data and reports to:
Analyze customer behavior and outline their sales and marketing plans using data accordingly.
Study historical data, trends, and patterns to accurately forecast potential risks or challenges.
Take preventive measures based on research findings and deploy risk analysis and management methods.
Research data analytics empowers research analysts to understand- What happened in the past? What is happening? And what will occur in the future?
They engage expert data engineering services to generate insights reports and research papers based on identified statistics, facts, and patterns.
Optimize your Research Process with our Data Reporting and Management Solutions
Let's discover why leading global research analysts and firms opt for professional data analytics services.
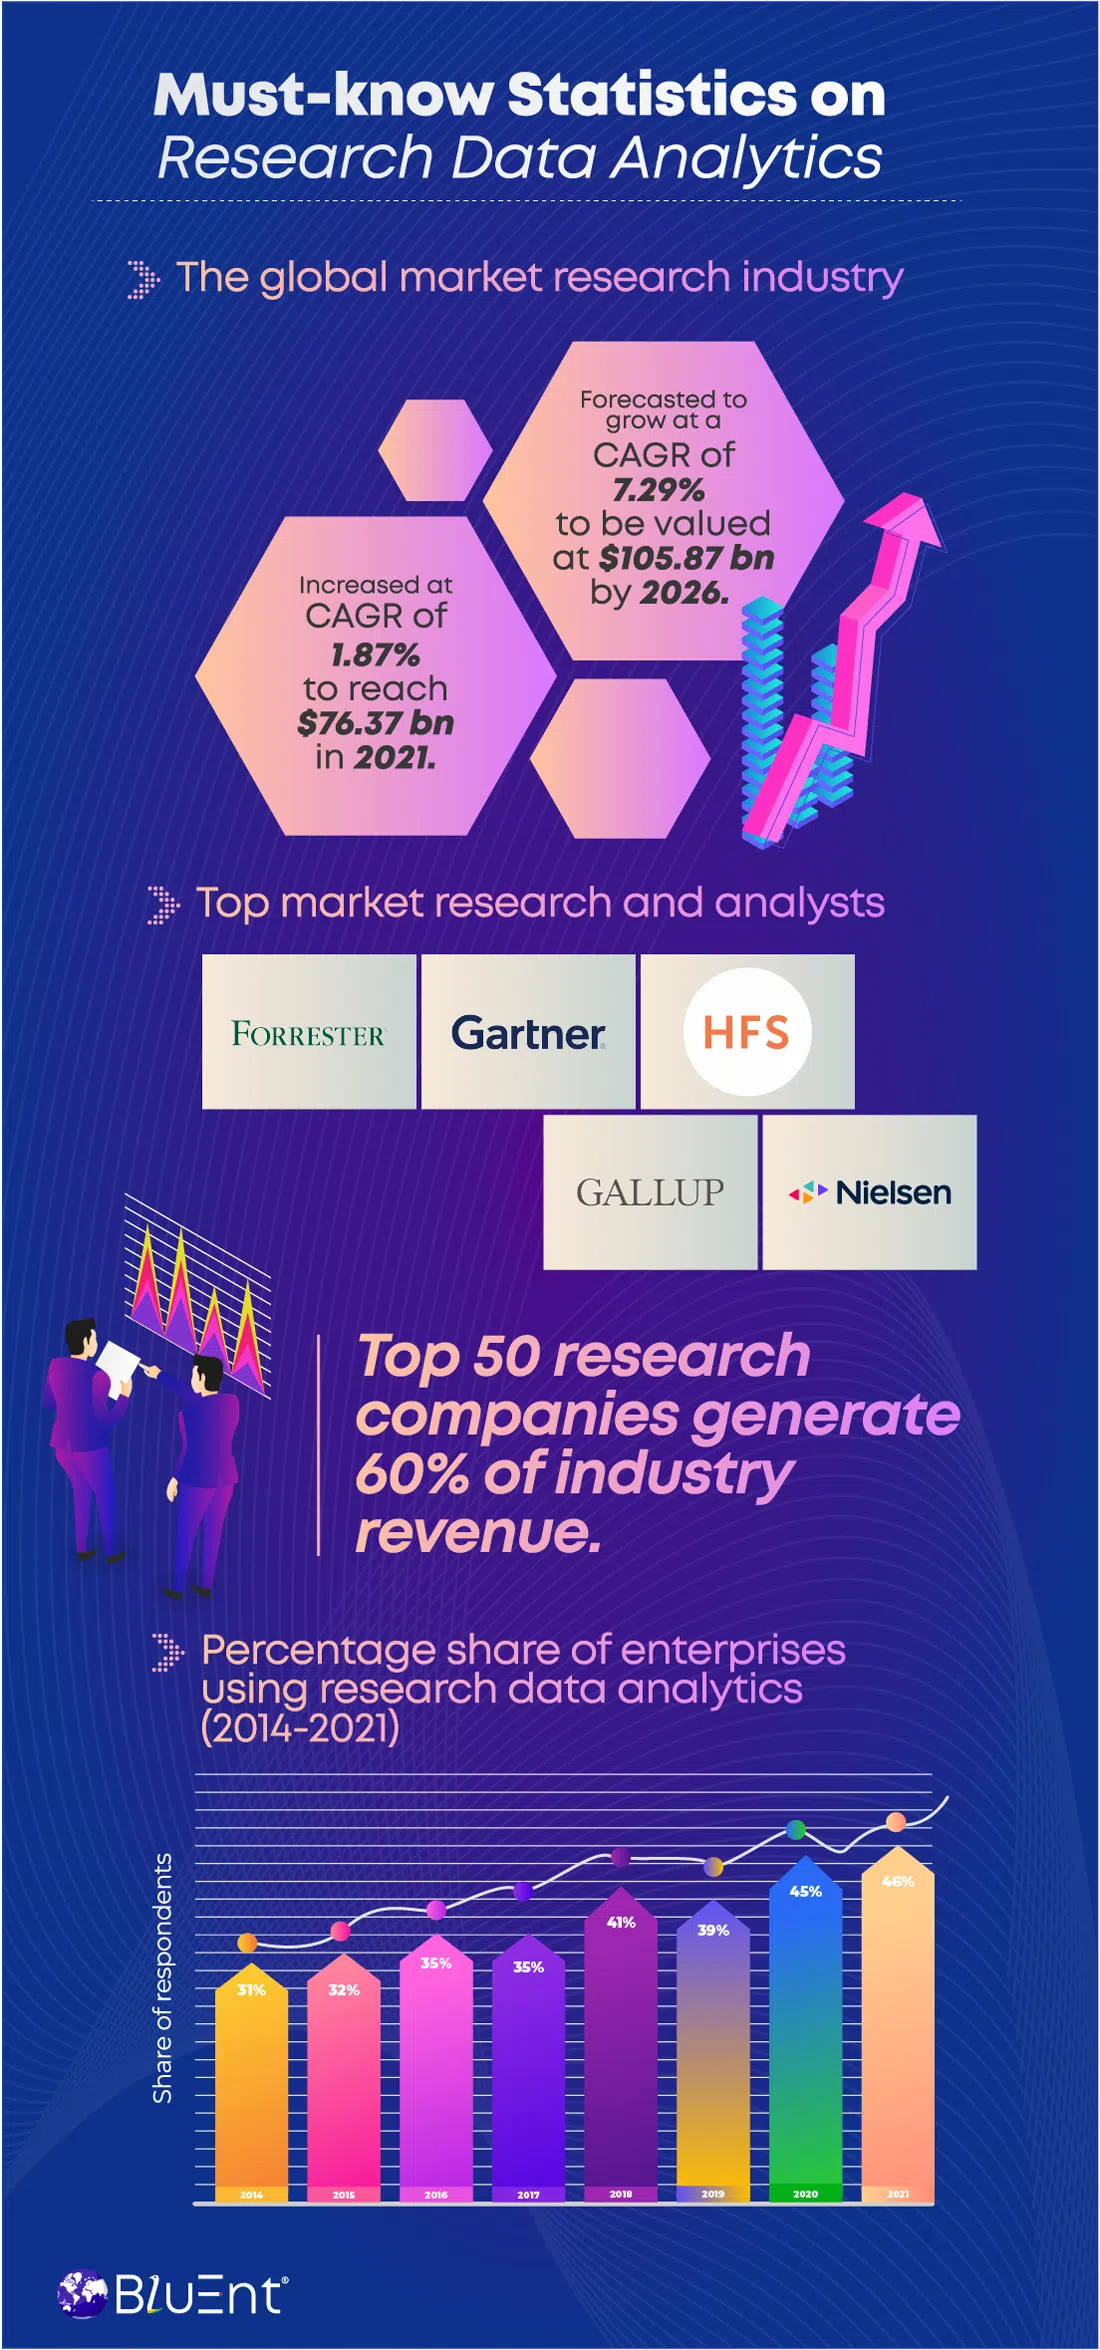
Why Should You Implement Big Data and Research Analytics?
Data analysis in research is a set of practices businesses apply to collect, manage, and analyze data for proper decision-making.
It gives access to reliable data insights that can be used to generate actionable reports and research findings for different businesses.
For example, medical researchers are using future data analytics trends to anticipate pandemic-like scenarios and take measures to avoid them. They collect historical statistics to analyze the impact of COVID-19 on the global population and patients from specific genders, ages, regions, and countries.
They capture relevant data on symptoms, complications, recovery, mortality, treatment, post-recovery outcomes, and other factors using EHR and predictive analytics in healthcare. That helps them get a clearer picture of every aspect of the recent pandemic.
Here are the benefits of using data analytics in research and surveys:
Summarize and categorize disorganized data from multiple sources and organize them in one place.
Simplify collecting, ordering, and managing piles of data placed across various servers and databases with data mining.
Make data interpretation easier and less time-consuming for researchers, enabling them to reveal facts based on their study and publish reports that are worth the interests of the public and enterprises.
A more efficient and secure way to extract, share, and manage personalized reports and research studies for independent research analysts and agencies.
Conduct surveys and showcase results with the help of advanced data visualization tools and reporting software such as HubSpot, Tableau, QuickSight, etc.
Recommended Reading:
Types Of Data Analysis in Research
Research data analysts help you deal with too many versions of data available for analysis and reporting.
Most award-winning research firms benefit from innovative BI solutions to collect all forms of data in one place to process further and present it in a helpful format.
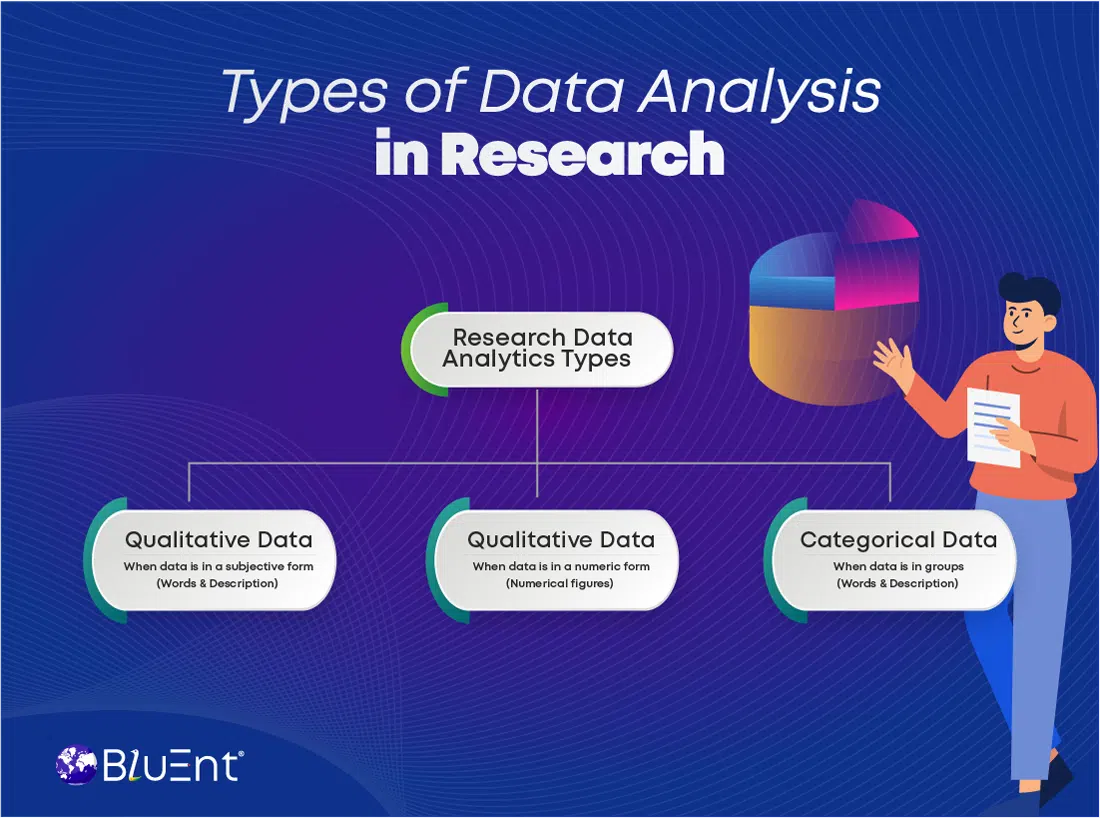
There are three types of data analysis in research and here are they:
Qualitative Data
Data collected from verbal opinions, interviews, surveys, and other interactions come into this category.
This type of data analysis in qualitative research is present in words and descriptions. Researchers usually get qualitative data in a subjective form and use it for comparison.
Quantitative Data
Data defined in a numerical format is referred to as quantitative data. Research analysts conduct data analysis in quantitative format to present reports in graphs, charts, and other pictorial formats.
Quantitative data analysis contains insights related to age, scores, points, rates, and numbers.
Categorical Data
Categorical data is when researchers find multiple data and business insights in groups that can only belong to one category or group.
How to Use Qualitative and Quantitative Research Data Analytics
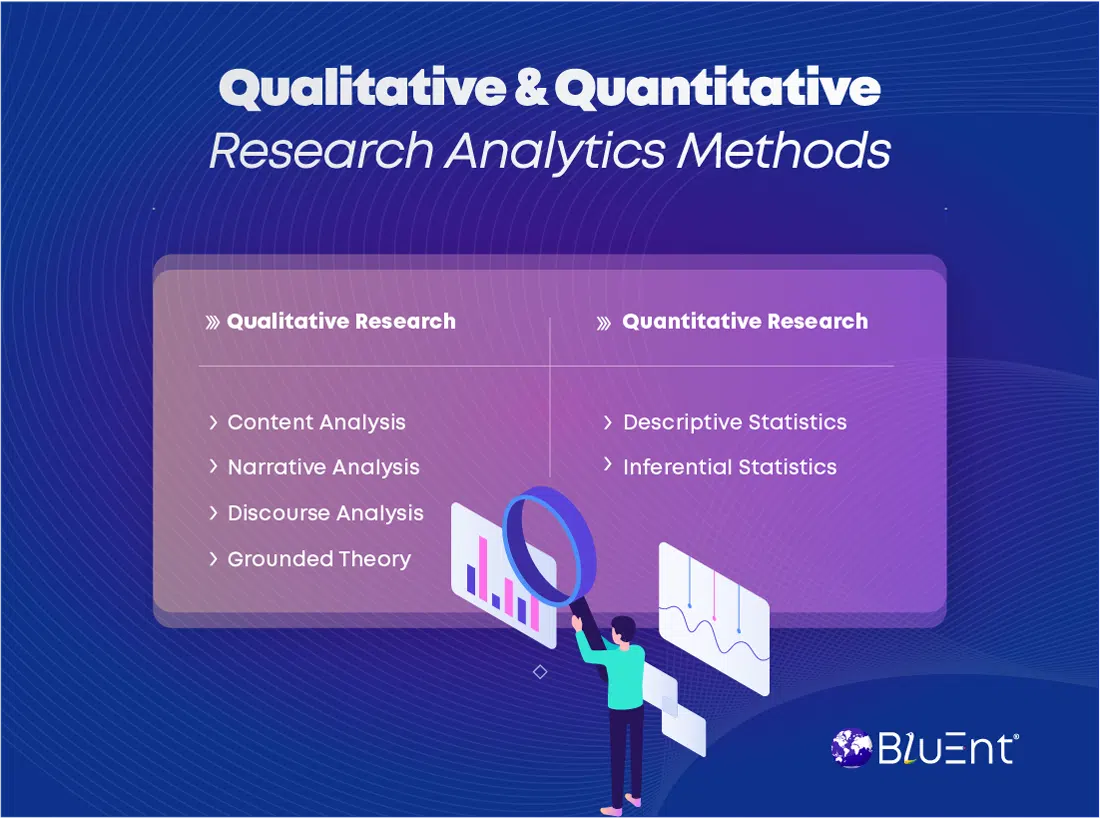
Methods to Conduct Data Analysis in Qualitative Research
Let's check out some brilliant techniques for using qualitative data analytics in research.
Contact Analysis: One of the most preferred data analytics methods for productive research and reporting. Companies hire data engineers to analyze data derived from images, texts, and physical environments.
Analysts usually apply predictive analytics with ongoing research procedures to find the right time to perform contact analysis.
Narrative Analysis: It involves analyzing the content gathered from interviews, verbal opinions, discussions, debates, field observations, etc.
Researchers consider viewpoints from popular interviews, stories, and words from participants on specific research questions and add their unbiased findings to their reports.
Discourse Analysis: Like narrative analysis, discourse analysis focuses on interactions with people. However, this research data analysis involves people's day-to-day environment and living conditions.
Grounded Theory: This kind of data analysis in research occurs when ground research is required to analyze a particular phenomenon or happening.
Methods to Conduct Data Analysis in Quantitative Research
Here are the vital methods for doing quantitative research analysis:
Descriptive Statistics: Transforming descriptive data into meaningful information for research papers and studies comes into this category.
In descriptive data analytics, researchers study the general features of data and interpret them after in-depth analysis.
Inferential Statistics: This type of quantitative analysis in research revolves around predictive analytics for risk management for a large population or a group of individuals.
Research analysts do sampling and estimate parameters to come up with a conclusion.
Recommended Reading:
Solving Research Problems with Streamlined Data Reporting and Management at BluEnt
Research data analytics is a cornerstone for impactful research studies and reporting. The advantage of data implementation and analysis is that it caters to the needs of modern research professionals and consulting firms with a global clientele.
However, it's always better to approach experts to get what you expect from research data analytics and reporting. At BluEnt, we bring over two decades of experience in business consulting with value-engineered excellence in broader areas of IT and CAD engineering domains.
With specialization in data analytics, we've been catering to research, finance, healthcare, gaming, human resources, eCommerce, and marketing brands for data engineering, data science, and data visualization services.
Want to modernize your research analytics and reporting setups? Talk to our research analysts and data engineers.

 Business Intelligence and Analytics: How one complements the other?
  Predictive Analytics in Finance; A Truly Transformative Idea
  Data Visualization in Finance: Telling Better Stories and Helping Make Even Better Decisions
  Big Data Applications in Healthcare: An Overview